
Azure Functions and Event Hub Throughput
Real-time event processing is integral to how companies operate. From inventory updates when shipments arrive at a store to table availability when reservations are made a restaurant, every business operates off of a series of events. When we model solutions to fit business needs, event processing is an inevitable part of those solutions.
Event Processing Architecture
A common architecture in Azure for event processing pipelines is to use Azure Event Hubs as the eventing platform and Azure Functions as the compute platform that processes those events.
If you’re unfamiliar with Azure Event Hubs, they are very similar to Apache Kafka topics (and even have Kafka endpoints) that store an immutable, partitioned event log for consuming applications to read from.
Essentially, producers send events into the Event Hub and the Azure Function App reads those events in batches to process them and send them downstream to another system, like another Event Hub or a database.
Throughput Considerations
I was working with a team recently that was trying to build out this exact architecture and they claimed that Azure Functions was unable to keep up with a high throughput scenario.
That didn’t seem right to me because I had seen other teams build high throughput pipelines like this and not have any issues. Granted, the teams without issues had been building their Functions using C# in-process workers and the team I was talking to was using out-of-process Java workers.
In the end, I decided to create a sample processing pipeline using Java to see what type of throughput I could achieve. My goal was to try and process at least 100,000 events/sec in the consuming Azure Function.
To put this event processing rate in perspective, statista estimates 2 trillion text messages were sent in the USA during 2021. That breaks down to ~63,000 messages/sec. My goal was to try and consume around 1.6x that amount of events/sec.
Test Setup
For my test, I created two Azure Function apps. One to produce events and one to consume events. You can find the code and the infrastructure deployment files at https://github.com/joelwaymack/func-eventhubs-throughput-java. (Note, this post is using the high-throughput option noted in that repo.)
Tests like this need to have more load than is generated by simply logging output statements in the consuming Azure Function so I set the consumer up to calculate the first X primes where X is an integer in each event. Each event also has a “dummy” payload to simulate a reasonable event size.
I used a Premium Event Hub namespace to mitigate any throttling issues. Basic and Standard tier Event Hub namespaces have a quota limit of 40 throughput units (TUs) and each TU has a maximum event ingestion rate per second of 1000 events. To get above this 40,000 events/sec limitation, I needed to use a Premium tier Event Hub.
The Function Apps are both hosted in Consumption Tier Function App Plans. While most teams will opt to use Premium Function App Plans for networking, fast scaling, and computing resource requirements, I decided to see if I could get this working with the cheapest option.
After playing around with the event producer Function App settings and the event consumer Function App settings I finally settled on the following values:
- Event Hub
- Partition Count: 100
- Capacity Units: 16 (can be reduced to 8 after production and consumption stabilize)
- Event Producer Function App
- Batches per Timer: 200
- Events per Batch: 550
- Value for Event: 25
- Dummy Payload: 1KB
- Event Consumer Function App
- Batch Size: 256
- Prefetch Count: 512
The above settings should generate ~120k events/sec.
Results
After getting everything deployed, we get some exciting results! Overall, this solution performs really well.
(Note: the bin() function in some of these charts will cause the beginning and end values to be inaccurate. I tried to either cut out the bad values or grab the charts when they were close to the representative values.)
Events/Sec
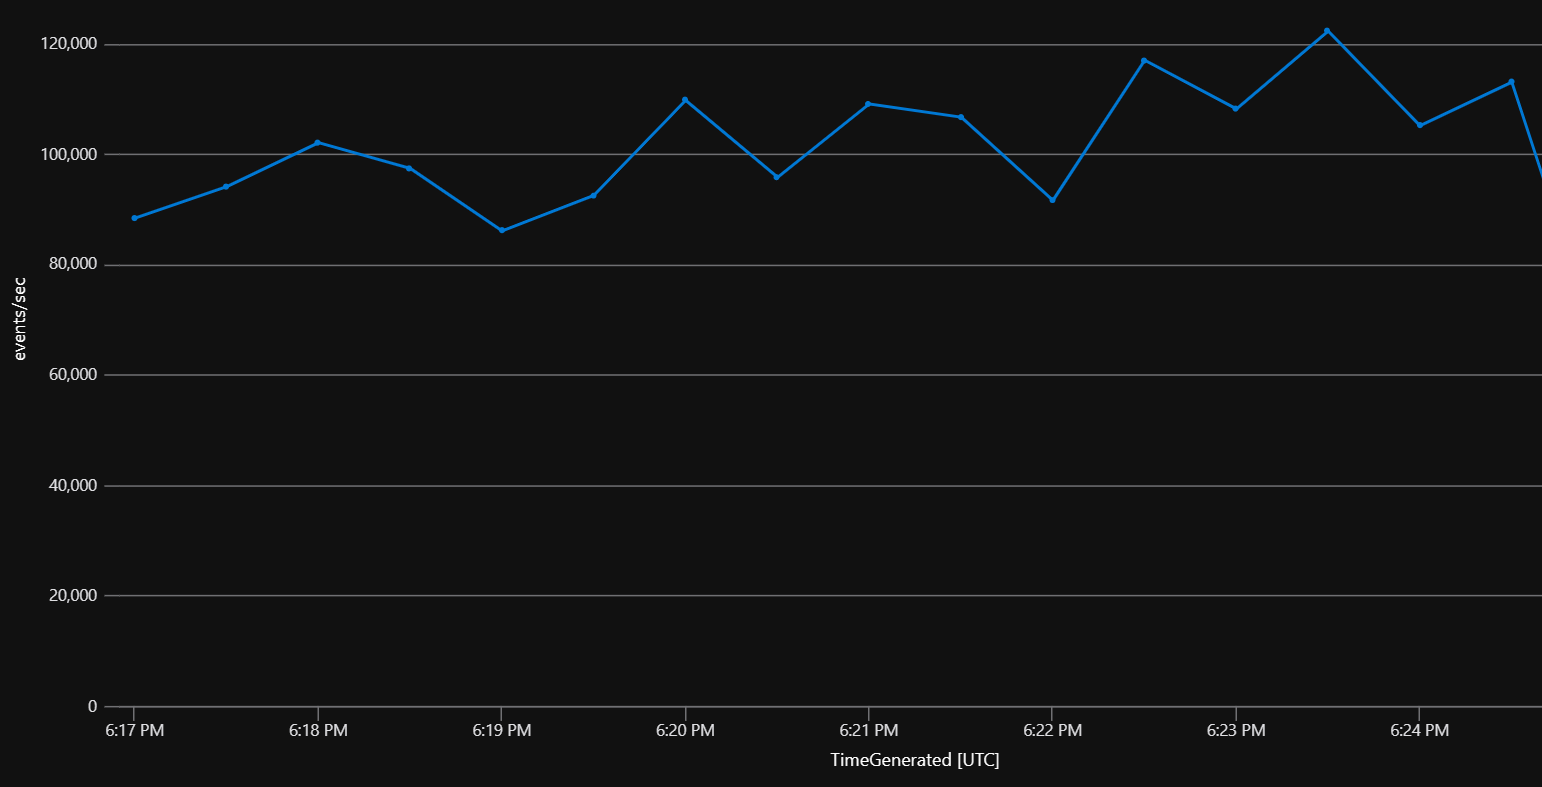
In total, consumption hovers around 105k events/sec once the system has stabilized. This is great! We hit our target!
FunctionAppLogs
| where FunctionName == "ConsumeEvents"
| where Message startswith "Trigger Details: Parti"
| where TimeGenerated > ago(10m)
| parse Message with * ", EnqueueTimeUtc: "
enqueueTimeStart:datetime "+00:00-" enqueueTimeEnd:datetime "+00:00," * ", Count: "
messageCount:int
| summarize ['events/sec'] = sum(messageCount)/30 by bin(TimeGenerated, 30s)
| render timechart with (ymin=0)
Consumer Instances
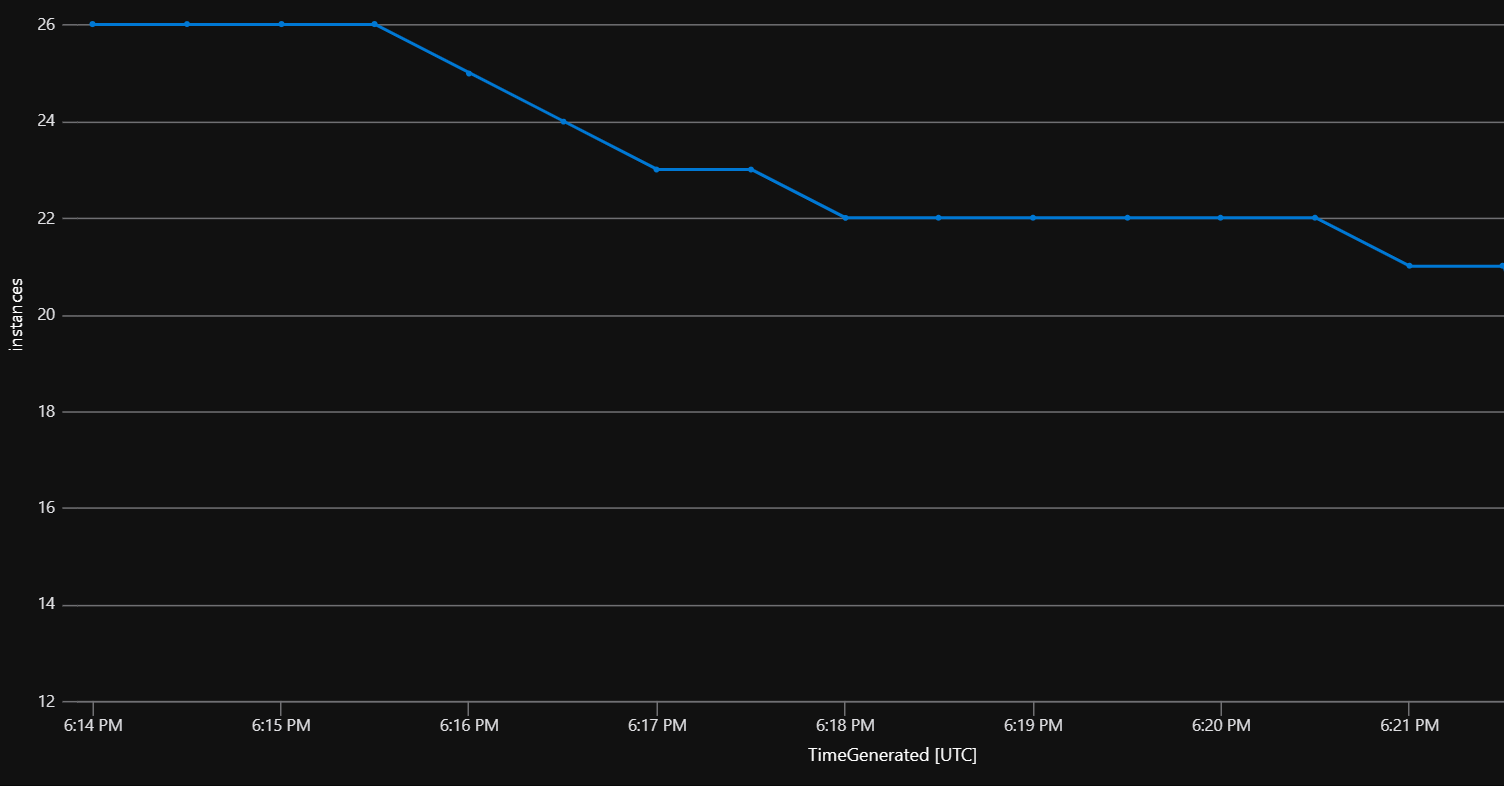
The consuming Function App instances fluctuate but generally sit at about 23 instances. This indicates that each instance is handling the events in ~4 partitions. If we were hitting maximum throughput on the consumer side, we would have a 1:1 ratio of partitions to Function App instances due to how the Event Hubs client (the underlying SDK for the Event Hubs trigger in Azure Functions) locks a partition for processing to one consumer instance. In essence, the Azure Functions consumer could theoretically handle 4x the load (400k events/second) before running into issues.
FunctionAppLogs
| where TimeGenerated > ago(10m)
| where FunctionName == 'ConsumeEvents'
| summarize ['instances'] = dcount(HostInstanceId) by bin(TimeGenerated, 30s)
| render timechart
Dispatch Time
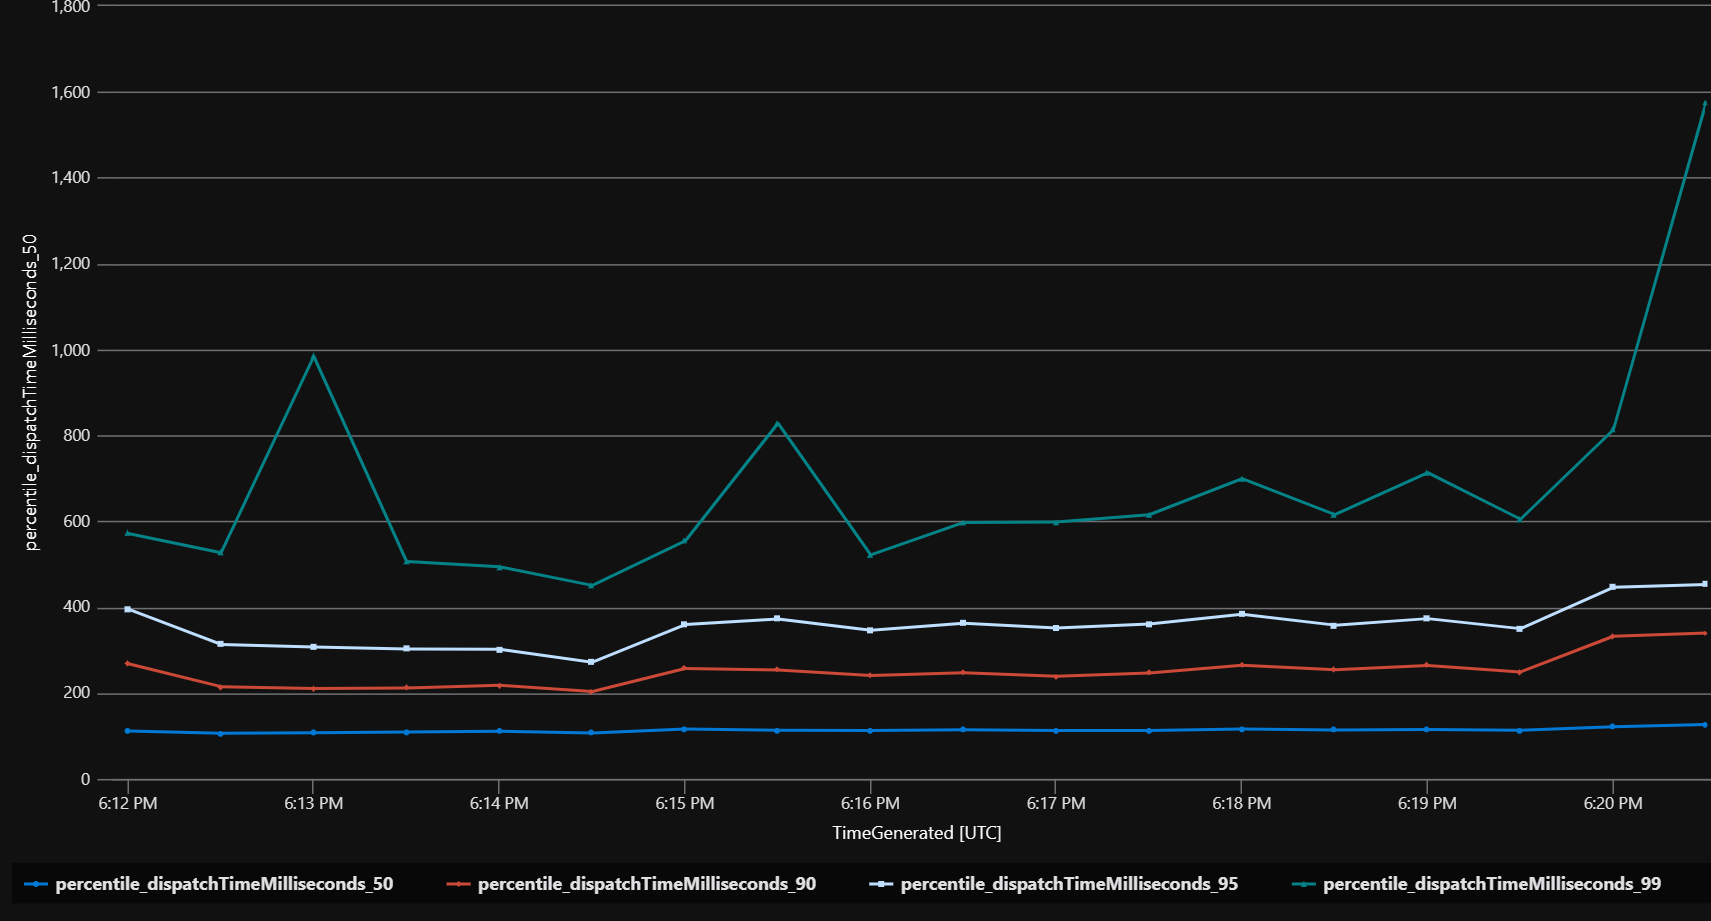
It’s important for events to be consumed as quickly as possible after they hit the Event Hub so that they are streamed in near-real-time. This chart shows the average dispatch time based on event percentile. I saw random spikes of up to 25s for the 99th percentile but a 95th percentile of less than 500ms seems like an excellent dispatch time. Essentially, events are being processed very quickly through the system.
FunctionAppLogs
| where FunctionName == 'ConsumeEvents'
| where TimeGenerated > ago(10m)
| where Message startswith "Trigger Details: Parti"
| parse Message with * "tionId: " partitionId:string ", Offset: "
offsetStart:string "-" offsetEnd:string", EnqueueTimeUtc: "
enqueueTimeStart:datetime "+00:00-" enqueueTimeEnd:datetime "+00:00, SequenceNumber: "
sequenceNumberStart:string "-" sequenceNumberEnd:string ", Count: "
messageCount:int
| extend dispatchTimeMilliseconds = (TimeGenerated - enqueueTimeStart) / 1ms
| summarize percentiles(dispatchTimeMilliseconds, 50, 90, 95, 99) by bin(TimeGenerated, 30s)
| render timechart
Event Hub Resources
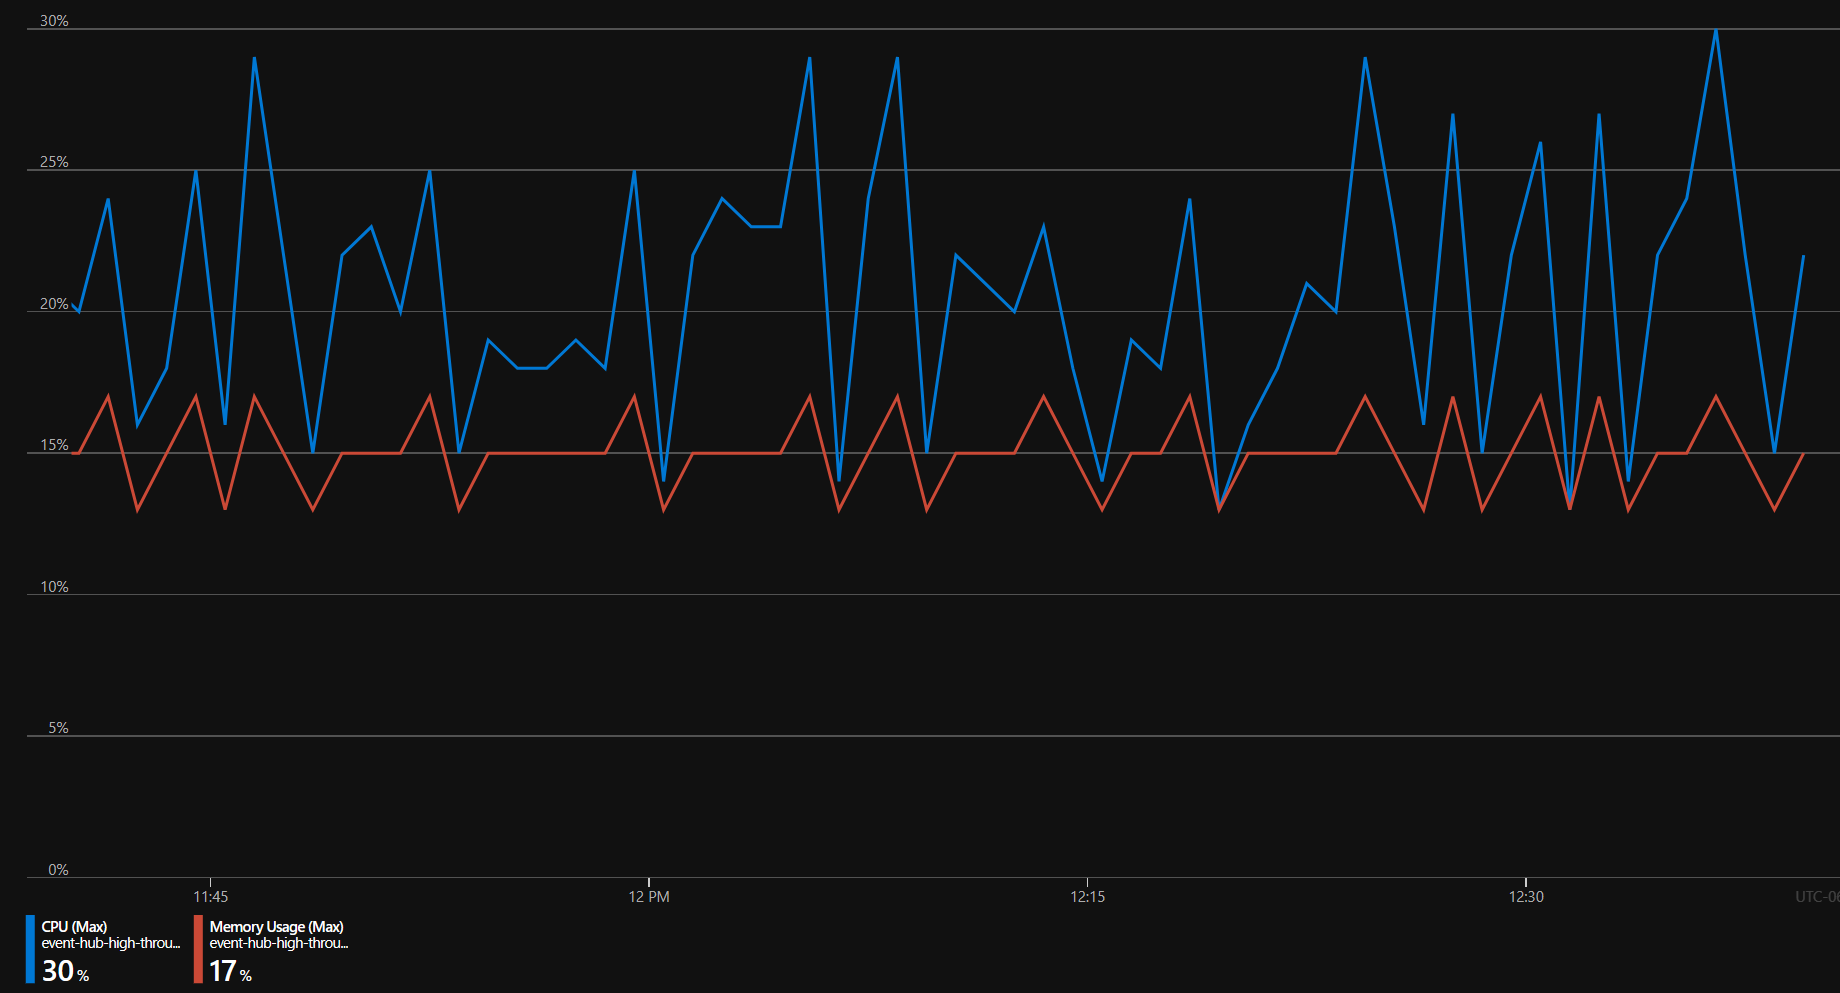
The Event Hub also has computing resources provisioned as Processing Units. I had 16 PUs provisioned for this test. You can see the CPU usage (the limiting resource) hovered around 25% utilization. This means the system could handle a large spike without issue since the producer and consumers use the same Event Hub computing resources. If we saw a near 100% utilization, the Event Hub is smart enough to prioritize ingestion over consumption so that, when the ingestion died back down, the consumer could try to catch back up.
Event Hub Message Throughput
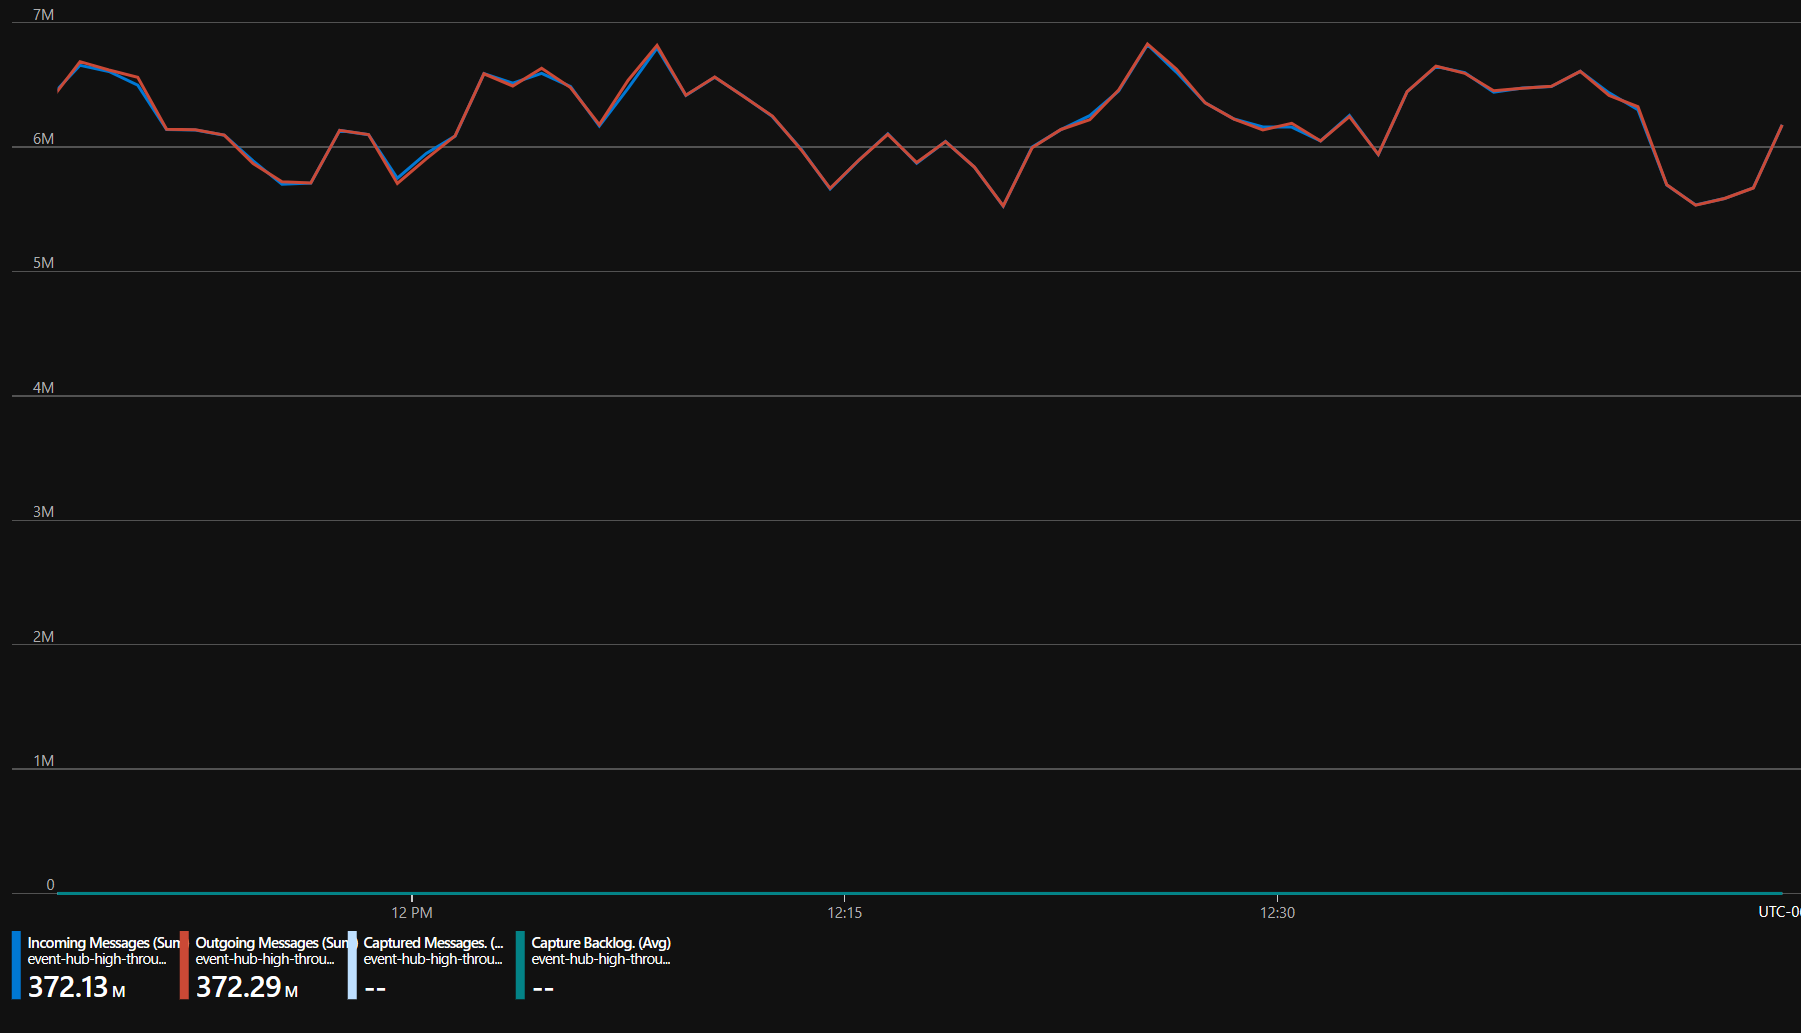
The Event Hub shows us that the events are being ingested and consumed at a nearly identical rate confirming that our dispatch times are accurate and that we don’t have a massive backup of un-consumed events.
Producer Instances
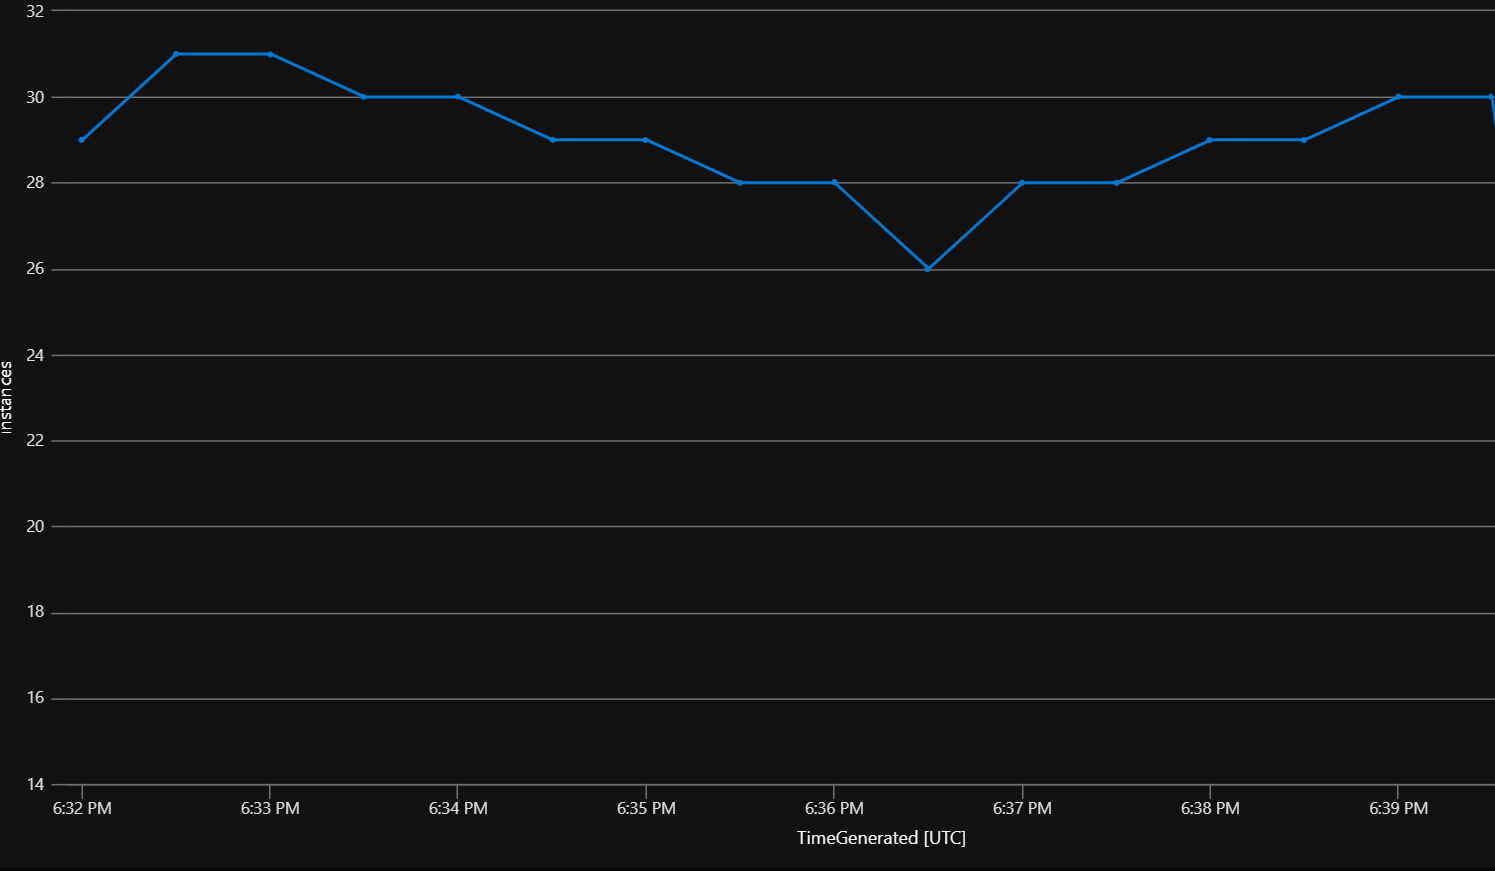
While we aren’t very concerned about the producer instances, they obviously control an important aspect for our test. If we got near the 200 instance mark (the maximum for a Windows Azure Functions Consumption Plan), we would be hitting the event production limit and we wouldn’t be able to push more events. Overall with a baseline of about 30 instances, we could generate a lot more events before hitting a tipping point.
FunctionAppLogs
| where TimeGenerated > ago(10m)
| where FunctionName == 'ProduceEventBatch'
| summarize ['instances'] = dcount(HostInstanceId) by bin(TimeGenerated, 30s)
| render timechart
Crank It Up
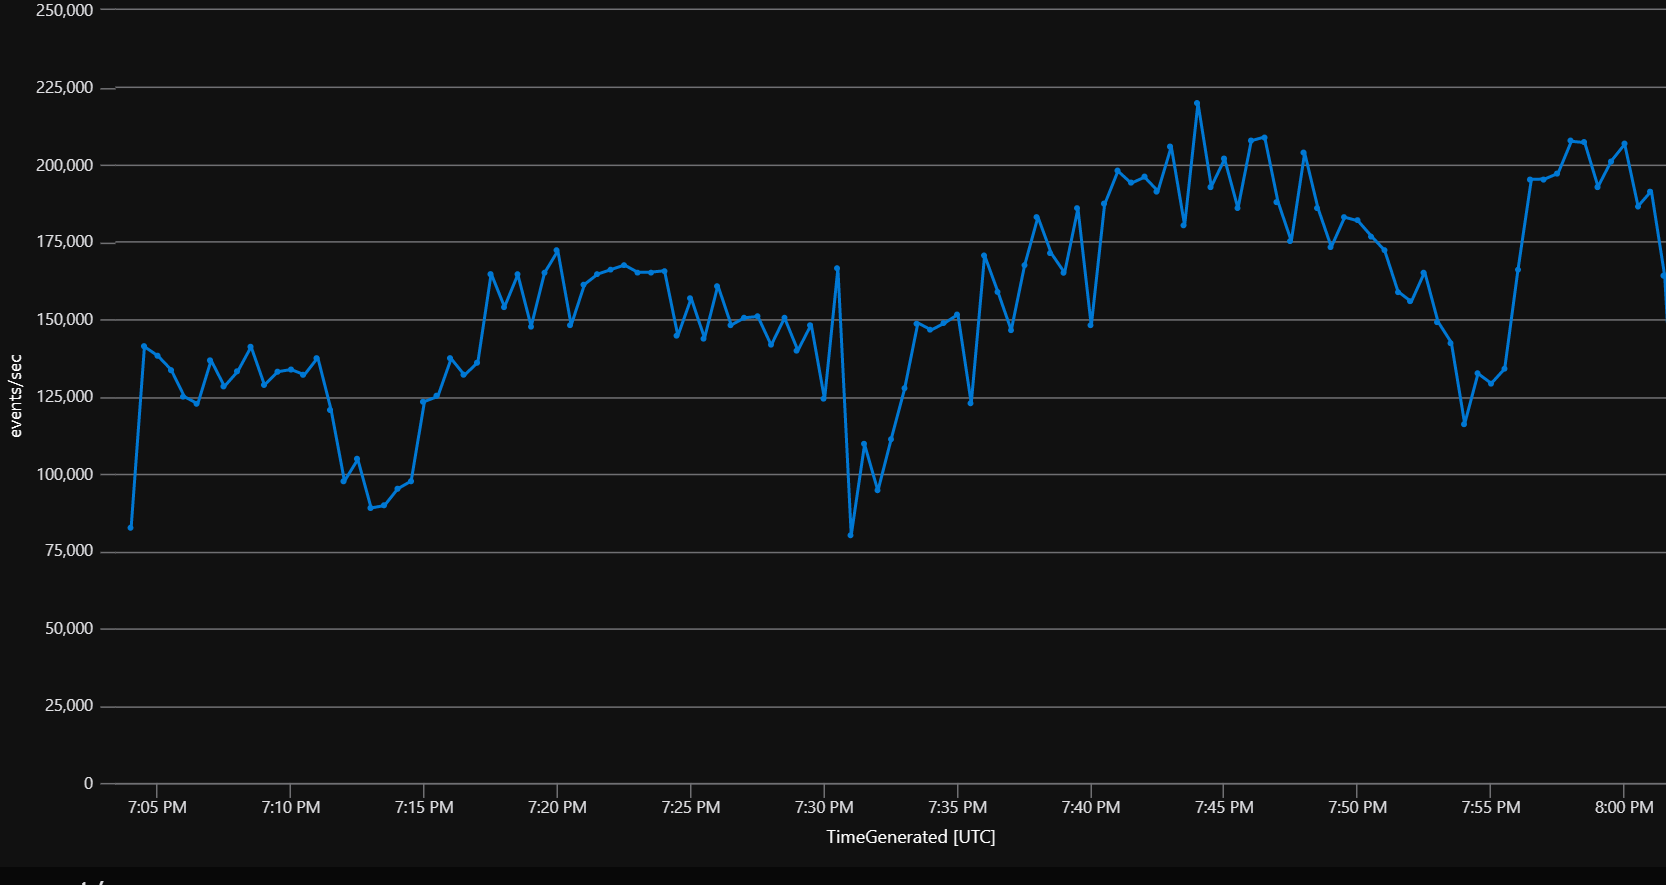
For my last test I decided to continuously increase the batches per second that the producer was sending until I saturated the Event Hub resources and started to get a back up of un-consumed events. I started maxing out the computing resources of the Event Hub when producing 400-500 batches (220-275k events/sec). Note the limiting factor is not the Function App or the scaling of the Function App. The limiting factor is the Event Hub computing resources. At this point, an Event Hub Dedicated cluster could be provisioned to increase the throughput.
Even so, the consumer was chugging away and hit some pretty amazing stats with only ~50 instances running.
Important Notes
To ensure we get accurate results, all of the logs were sent directly to a Log Analytics workspace through the Function App diagnostic settings instead of relying on Application Insights telemetry. At the scale of execution we have, App Insights will start to do telemetry sampling so it doesn’t hit the ingestion limit of the App Insights endpoint. This type of sampling would only show us a fraction of the actual throughput and logs.
It’s important to note the most expensive part of this entire solution wasn’t the Event Hub Namespace ($12k/mo) or the two Function App Plans ($3.6k/mo). It was my Log Analytics Workspace (~$73k/mo). This was a costly reminder that you should only log what you truly need. I should have turned off all App Insights telemetry capture and changed the logging settings so I was only capturing the logs I needed. (I only ran this for a few hours, so I didn’t rack up as big of a bill as you might expect.)
Conclusion
Well, it looks like Azure Functions can handle high throughput event processing. Based on my testing, we were about to process ~225k events/sec before the the Event Hub Namespace resources started limiting event consumption. With a dedicated tier Event Hub Namespace, we could likely go even higher.
